
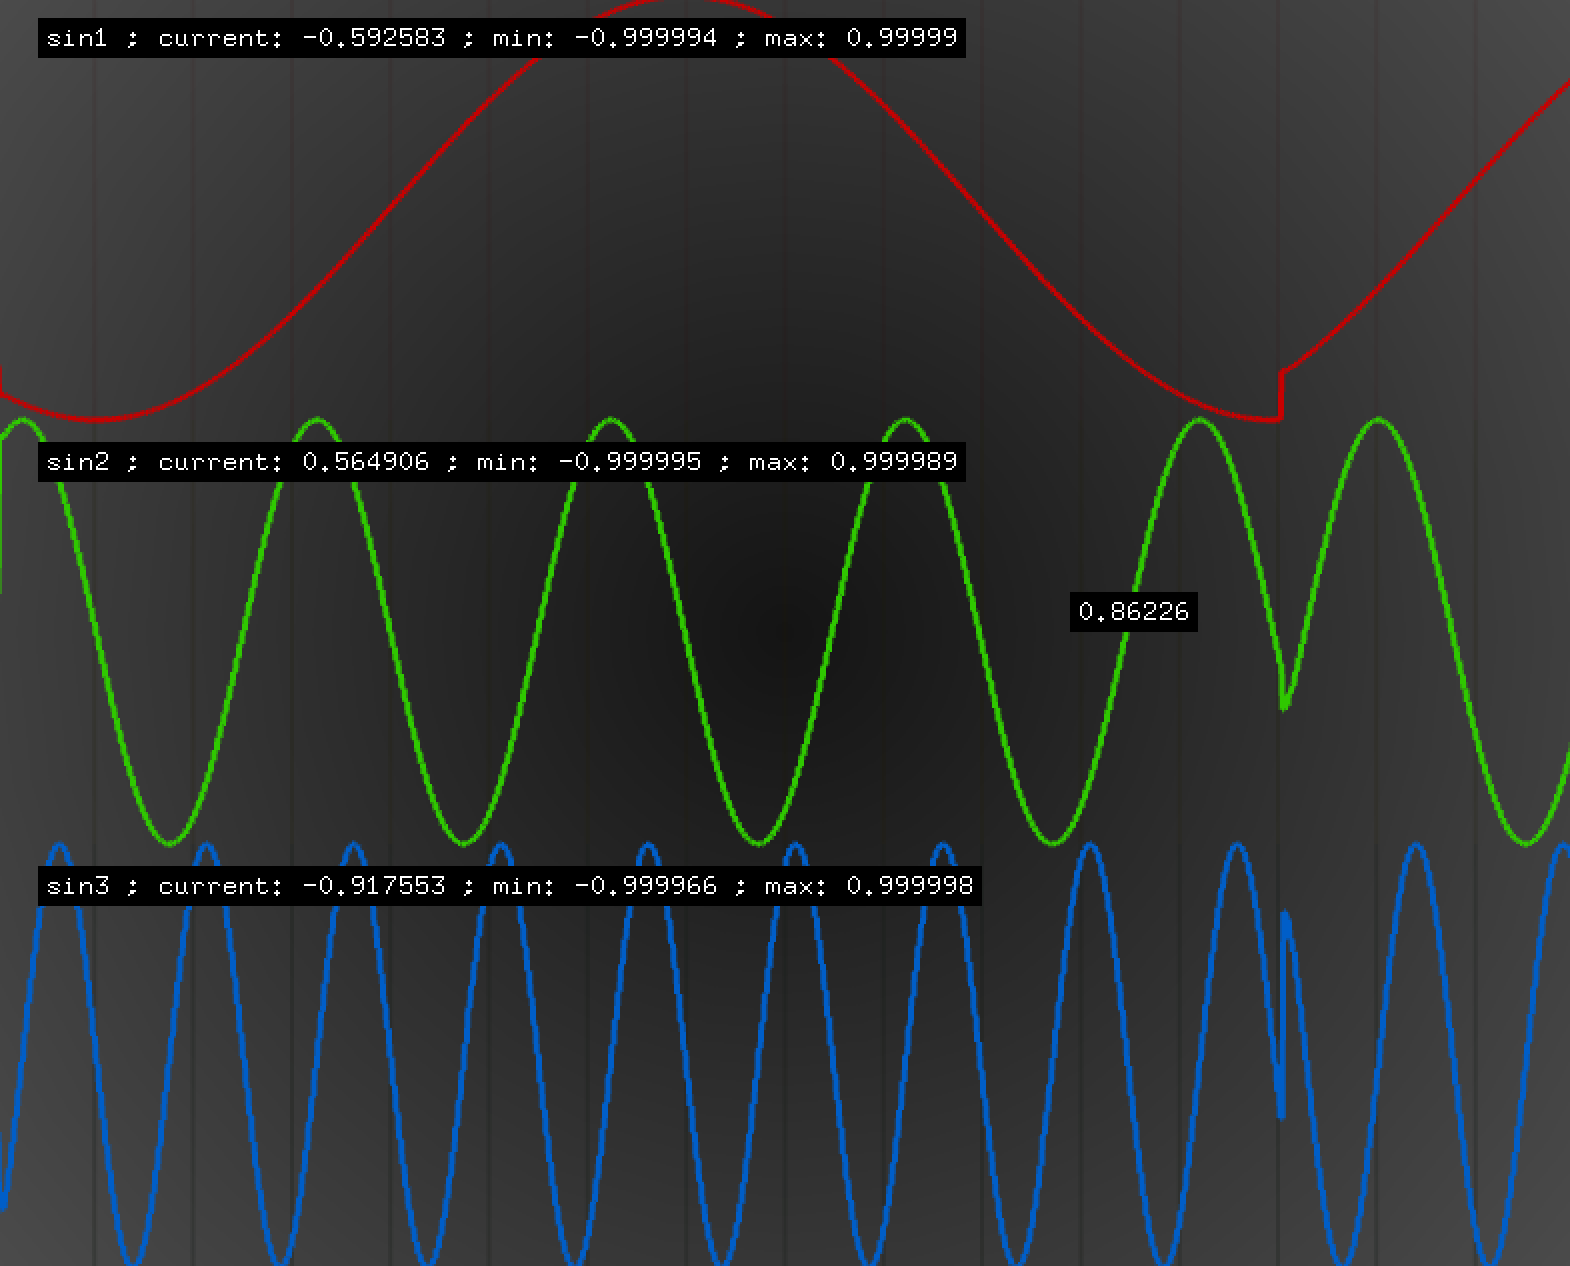
ofxPlotter allows to plot data on screen.
 Juan Carlos Carvajal Bermúdez
a9c4485309
Adopted example. General clean up
Juan Carlos Carvajal Bermúdez
a9c4485309
Adopted example. General clean up
|
8 년 전 | |
|---|---|---|
| example | 8 년 전 | |
| src | 8 년 전 | |
| readme.md | 8 년 전 | |
| screenshot.png | 8 년 전 |
readme.md
ofxPlotter
Introduction
A simple function plotter class for openFrameworks with built-in variable filtering and a ascetic syntax.
Requirements
It requires C++11 so it will work on any oF distribution past 0.9. Should work on all the major OSes (Windows, OSX, Linux, Android, iOS), no special requirements here.
Usage
ofxPlotter is designed to be as simple and as minimal as possible for plotting functions in realtime.
plotter["myData"].setPlotLength(240); // set the number of values to be stored plotter["myData"].setColor( ofColor(255,0,0) ); // set the color of the plot plotter["myData"].setMinMaxValue( 0.f, 1024.f ); // set the min and max values plotter["myData"].drawGuidelines = false; plotter["myData"].drawInfo = false; plotter["myData"].drawOverlay = false;
plotter["myData"].setCurrentValue( variable ); // add a new data to the plot "variable name". Takes int and float
plotter.drawPlot("myData", 100, 100, 300, 300); // draw a single plot. x,y,width,height
plotter.drawAll(); // Every variable name's plot will be drawn using the whole screen